Performance Over a Decade – US vs EU
 There are a number of factors which determine the real GDP growth of a country or a region, and by making reference to the neoclassical or Solow growth model, the potential GDP growth of an economy is subject to the capital, labour and raw materials used in production, combined with the discovery and application of new technologies. Such technologies in turn make the inputs utilised in the production process more productive.
An important metric one ought to refer to in order to better understand how the production capacity of an economy is being fully utilised is capacity utilisation. In essence, companies tend to be little incentivised to invest in new capital and labour if they are currently experiencing excess capacity. Whereas those companies operating at close to full capacity will tend to invest more such as to expand production and reach new targets. According to data provided by the OECD and the US Federal Reserve, capacity utilisation of around 82 to 85% triggers companies to invest more as they start to come across production bottlenecks. The chart below depicts the capacity utilisation of the European Union and the US over the past decade, which albeit already declining in 2019, took a nose-dive as soon as the pandemic broke out.
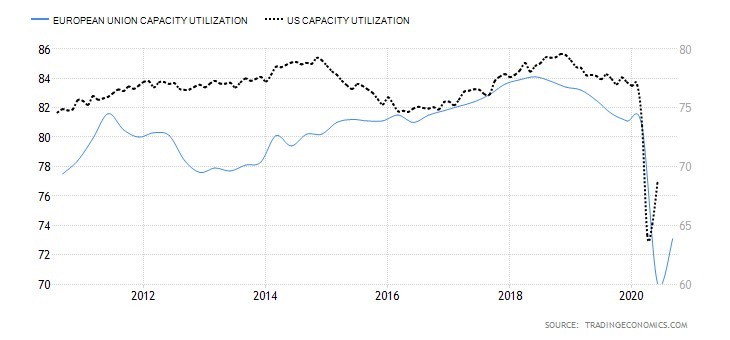
Such a slump in economic output was partially recovered over the months that followed, as fiscal and monetary measures across both regions were abundantly introduced. This was intended to somehow mitigate the collateral damage brought about by the pandemic with the hope to progressively shift the aggregate demand back to previous levels and slowly aid the economy to gain traction once again.
Although an economy’s productive capacity or GDP potential cannot be directly quantified by economists, the technological knowledge within an economy plays an important role in determining the potential output. As a matter of fact, the latter is not just determined by summing up labour and capital together, but rather a factor of the economy’s technological advancement, which although not directly observed, aids in generating a better and more productive output.
Linking the above theoretical aspect as to what contributes towards growth within an economy to the world in financial markets, one could just make a simple observation at the respective economies’ broad indices. Assuming that the S&P 500 index is a good proxy for the US economy and the Eurostoxx 600 for the European economy, by observing the tech sector component in each of the respective indices one can better understand the contribution such sector has had towards the overall performance over time – and whether such sector has indeed been a reflection on the economies’ productivity, as calculated by the GDP per capita growth.
Going back to the beginning of 2010, the S&P 500 index has appreciated by an astonishing 270%. This compares to circa 107% advancement recorded in the Eurostoxx 600 index. However, data extracted from Bloomberg provides an interesting perspective when analysing the respective sector contribution to the overall performance.
With an average sector weighting of close to 18%, the Tech sector alone in the US has accounted for over a fourth of the overall performance since Jan 2010 – half of which was contributed by mega-cap companies Apple and Microsoft. It is also interesting to note that currently, the Tech weighting within the index increased to circa 28%, which excludes Amazon (consumer discretionary sector), Alphabet (previously Google) and Facebook (both forming part of the communication services sector) – which all three together account for another 10% of the S&P 500 index.
The Health Care sector also contributed to a whopping 39%+ out of the overall performance, followed by Consumer Discretionary (31%+) and Communication Services (28%+).
How does this compare to the broader European equity market?
Contrary to the US market index, the Tech sector representation had an average weighting of just over 4% over the past decade, which has now grown to 8% and having accounted for less than a tenth of the overall index’s performance. To put things into perspective, the two largest EU tech companies within the index are ASML HOLDING NV in the Netherlands and SAP SE in Germany, which collectively now account for circa 3.5% of the Eurostoxx 600 index.
The largest single contributor to Europe’s 107% advancement since January 2010 was the Health Care sector, accounting for a fifth of this performance, having an average weighting of 12.7% and a current weighting of circa 16%. This shows us the significant importance certain specific sectors and companies might have on an equity market index.
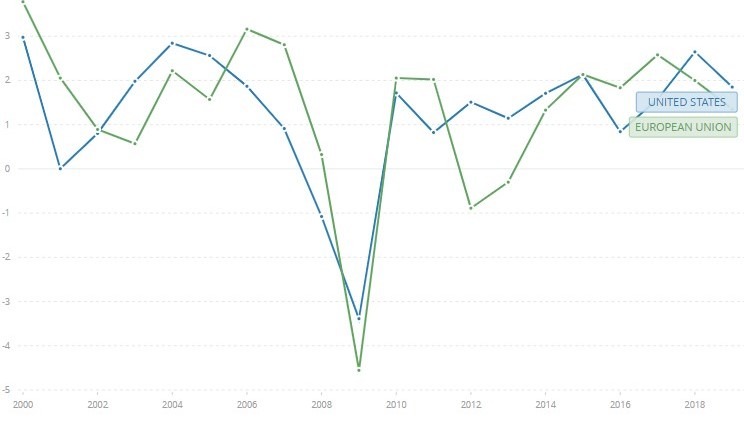
Nevertheless, one cannot conclude outright that a higher tech weighting in an index will be reflected in a higher GDP per capita growth rate within that economy. Data from the OECD, as depicted below, does in fact suggest a similarity in trend in GDP per capita growth rate over the years between the two regions.
In the context of portfolio management, therefore, it is also important to ascertain what is most suitable within your portfolio not just based on macro considerations (one region over another), but also at micro level – that is, the impact a specific sector or a company can have on the overall portfolio, both from a total return perspective as well as from a correlation (diversification benefits) perspective.
GDP PER CAPITA GROWTH RATE (ANNUAL %) – US vs. EU, WORLDBANK
Colin Vella, CFA, is the Head of Wealth Management at Jesmond Mizzi Financial Advisors Limited. This article does not intend to give investment advice and the contents therein should not be construed as such. The Company is licensed to conduct investment services by the MFSA and is a Member of the Malta Stock Exchange and a member of the Atlas Group. The directors or related parties, including the company, and their clients are likely to have an interest in securities mentioned in this article. Investors should remember that past performance is no guide to future performance and that the value of investments may go down as well as up. For further information contact Jesmond Mizzi Financial Advisors Limited of 67, Level 3, South Street, Valletta, on Tel: 2122 4410, or email [email protected]